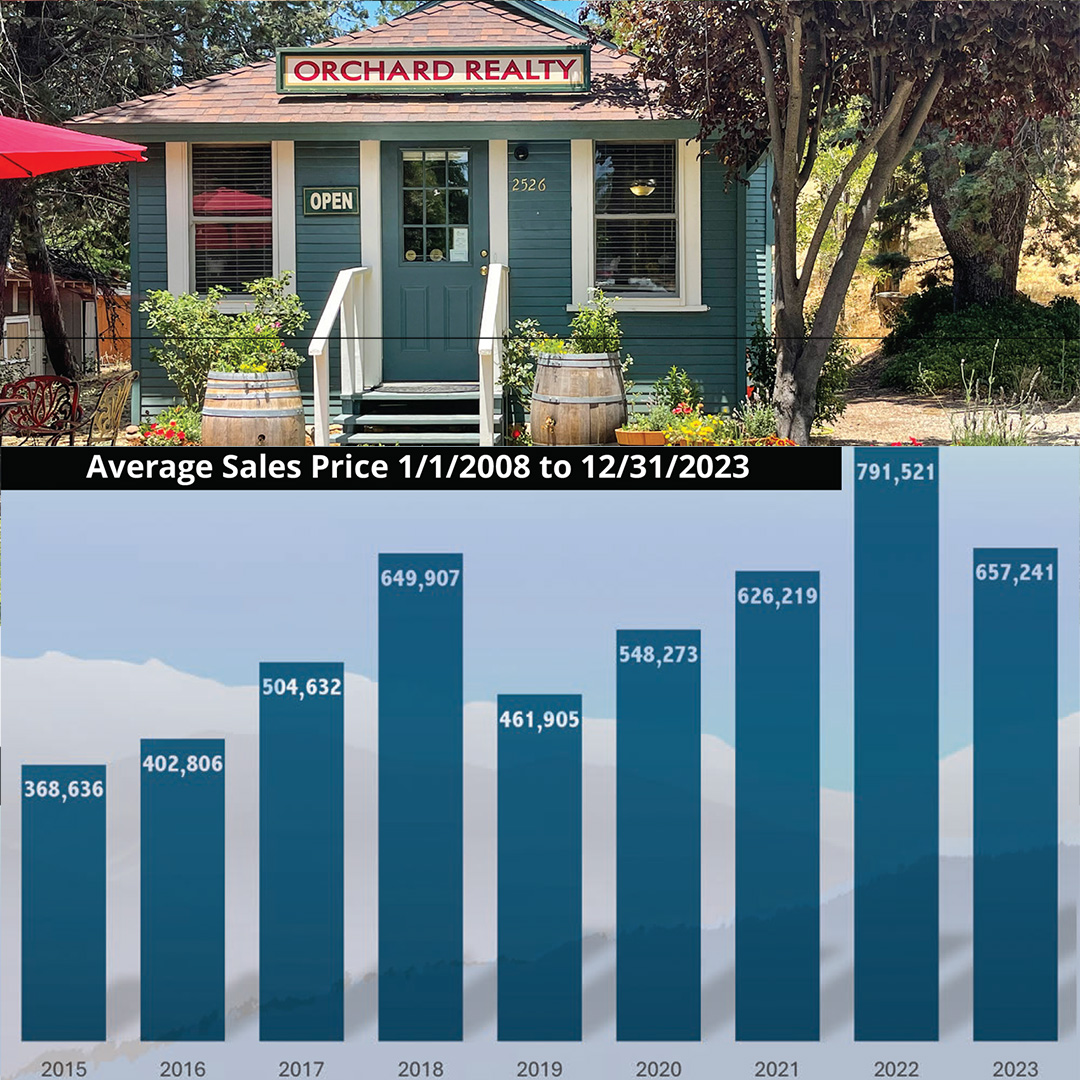
Changes in Real Estate and other markets occur in peaks, valleys and revolving cycles, and it’s safe to say 2022 was a peak year for home sales. So, what does the view look like coming down? My intention with this 2023 Market in Review article is to share the view from my perspective as a leading sales professional specializing in the Julian market since 2004.
To understand 2023 activity and the peak before it, it’s good to peer back into the valley before the climb. From 2009 through 2013, real estate sales were crowded with ‘bank-owned’ and ‘short- sale’ transactions. In the last quarter of 2013, the market began to level into an equity position and eventually climb into an apparent peak in 2018, followed by a mild descent that seemed like a normal cyclical change.
The surprise came with the 2019 pandemic, which dramatically changed the direction toward the new high experienced in 2022. The pandemic also opened fresh possibilities for the evolving work-from-home culture. More people found living and working farther from the usual urban work centers possible and affordable.
In 2023, the frenetic pace of 2022 home sales slowed. The radical days of four and five offers on a home in the first few days disappeared. In 2023, a total of 88 homes sold in Julian and Santa Ysabel, in contrast to the 134 sold in 2022; this represented 34% decrease.
The 2023 median home sale price was $548,750 vs. $533,750 in 2022. The 2023 median home had three bedrooms, two bathrooms, 1,437 square feet, and sold for $385.80/square foot in 33 days on the market.
For the past two years, home prices and mortgage rates have surged, severely limiting buyers’ purchasing power. In the first quarter of 2022, mortgage rates were in the 3% to 4% range. By January 2023, interest rates were in the 6.5% range and increased dramatically to 8% in October 2023. As an illustration, a mortgage payment on a $500,000 house in January 2022 would be $2,945, compared to $4,075 in October 2023— a 32% increase in monthly payments. With inflation, low inventory and little motivation for sellers to sell, this may make for an unhurried market in 2024.
At Orchard Realty, we are honored to have had another good year in a market despite a 34% decrease in home sales. I have much to be proud of and grateful for. I have closed over 220 sale transactions in my career, and Orchard Realty has closed over 414 in our Julian & Santa Ysabel community. As a company, we have grossed over 167 million dollars in sales, and I have personally sold nearly 100 million dollars of that in my Julian career; our experience truly does matter.
On a company note, David Bowie said it best in his song “Changes”: “I watch the ripples change their size but never leave the stream of warm impermanence.” I am excited to share my sales and broker experience with an innovative and enthusiastic group of professionals, including a commercial real estate broker affiliation, a licensed notary public, a new licensee with vacation rental property management experience and a design and staging background, and a licensed real estate appraiser, all under one roof. I became a full-timer in 2003 and am happy to call Julian home. I am grateful for the many connections I have made within this community and the company I have built. I look forward to 2024 and the fresh perspectives a new year can bring.
As one of the local agencies, a challenging trend has appeared as the reliance on local agents for home sales and purchases has dropped. Historically, local agencies have repre sented approximately 47-53% of the homes sold in Julian and Santa Ysabel. That trend has decreased from 54% in 2019 to 34% in 2023. Most local agency staff live in the community and support the schools, volunteer organizations, and businesses. This trend negatively impacts the livelihoods of the agents and the organizations they support. If you are considering buying or selling, please think of a local agent first—my best wishes to all!
Canebrake
Total homes sold: 1
Home size: 864 sq. ft., 1BD/1BA, 5 acres.
Sold price: $155,000 or $179/sq. ft.
List vs. Sale price: 7% discount off the list price.
Days on Market (DOM): 12 days
In Summary: This remote desert community is a wonderland for adventure some souls, rich with homestead history. Only one home sold quickly in 2023 vs. four home sales in 2022, which was a very active year for Canebrake.
Cuyamaca Woods
Total homes sold: 5
Median home size: 2BD/2BA, 3.76 acres
Median sale price: $385,000 or $412/sq.ft.
List vs. Sale price: 3% over asking price.
Median Days on Market: 38 days
In summary: Five homes sold in 2023 vs. 1 in 2022. Cuyamaca Woods is a popular community, the average parcel size is between 2.5 and 4 acres. Some lots have groundwater wells, and many have water meters serviced by the North Peak Mutual Water Company. Natural beauty makes quite an impression.The off-grid life-style has become a more comfortable and desired notion for buyers.
Harrison Park
Total homes sold: 2 Homes sold in 2023 vs. 3 Homes in 2022
Average home size: 2BD/2BA, 2,542 sq. ft. in 2023 vs. 2BD/1BA, 1,181 sq. ft. in 2022
Average sale price: $720,000 or $372.48/sq. ft.
List vs. Sale price: 1% discount off list price.
Average Days on Market: 78 days
In summary: In 2023, 2 homes sold here vs. 3 in 2022. Harrison Park is a nearby neighborhood experiencing new tree growth after the devastating 2003 Cedar Fire and it offers great proximity to many nature preserves, County and State Parks.
Historic District
Total sold: 2
Average size: 2BD/3BA, 2,465 sq. ft.
Average price: $992,500 or $462.45/sq. ft.
List vs. Sale price: 1% discount off list price.
Average Days on Market: 48 days
In Summary: Homes in the Julian townsite are part of the historic district and must conform to the standards of the Architectural Review Board. Many homes in this neighbor hood are small-ish cottages fitting into what is the heart of Julian’s charm.
Hoskings Ranch
Total homes sold: 2
Average home size: 4BD/5BA, 3,888 sq. ft.
Average sale price: $2,200,000, or $687.57/sq .ft.
List vs. Sale price: 1.16% discount off list price.
Average Days on Market: 87 days
In summary: Hoskings Ranch is a gated community comprised of parcels 40-plus acres. It is known as the luxury neighborhood. Homes rarely come up for sale here and when they do you can expect to pay top-dollar.
Julian General Area
Total sold: 5
Average size: 2BD/2BA, 1,666 sq. ft.
Average price: $781,400 or $484.60/ sq. ft.
List vs. Sale price: 1% discount off list price.
Median Days on Market: 38 days
In Summary: We describe the ‘Julian’ area as homes in the zip code yet not in a particular neighborhood or subdivision. This area includes homes outside of but near the townsite. In these areas you can walk to town yet have a home with a larger property. Popular streets would be Farmer Road, Wynola Road, Julian Orchards and Old Cuyamaca Road.
Julian Estates
Total sold: 3
Median home size: 3BD/3BA, 3,917 sq. ft. in 2023
Median sale price: $1,216,667, or $314.06/sq. ft.
List vs. Sale price: 1% discount off list price.
Median Days on Market: 34 days
In Summary: Julian Estates is a fabulous, gated community near the Julian townsite. The homes are situated on 4-acre + parcels with private wells, wide paved streets and underground utilities. Lots available for buyers who want to build their own custom home.
Julian in the Pines
Total sold: 1 Home in 2023 vs. 2 Homes in 2022
Average size: 5BD/4BA, 2,800 sq.ft. in 2023 vs. 2BD/2BA, 1,177 sq. ft. in 2022
Average price: $745,000 or $266.07/sq ft.
List vs. Sale price: 1% increase from list price in 2023 vs. 1% discount off list price in 2022
Days on market: 50 days
In summary: Near the townsite and in the Historic District, Julian in the Pines is a sub-division within walking distance to Main Street, mostly larger parcels than the townsites. Homes are generally on a private septic system.
Kentwood (I and II)
Total sold: 14 Homes in 2023 vs. 29 Homes in 2022
Median home size: 2BD/2BA, 1,475 sq. ft. in 2023 vs. 2BD/1BA, 1,184 sq. ft. in 2022
Median sale price: $527,964 or $391.28/sq. ft.
List vs. Sale price: 1% discount off list price in 2023 vs. 1% discount off list price in 2022
Median Days on Market: 80 days.
In Summary: The Kentwood neighborhood(s) typically have the most sales with moderately priced homes in the Julian area. These neighborhoods offer great selections of family-friendly affordable homes.
Lake Cuyamaca Resort
Total sold: 7 Homes sold in 2023.
Median home size: 2BD/2BA, 1,792 sq. ft.
Median sale price: $630,571 or $387.53/sq. ft.
List vs. Sale price: 1% discount off list price.
Median Days on Market: 59 days
In Summary: The Cuyamaca Lake Resort area homes are all about amazing views, proximity to the lake, and the fun outdoor activities that the lake, Cuyamaca Rancho State Park, and Cleveland National Forest present.
North Peak
Total sold: 2
Average size: 2BD/3BA, 1,892 sq. ft.
Average price: $715,000 or $378.01/sq. ft.
List vs. Sale price: 1% discount off list price.
Average Days on Market: 21 days
In Summary: This side of North Peak presents stunning panoramic views from the sparkling nightlights of Tecate, Mexico, over Lake Cuyamaca, and across to the downtown San Diego skyline with its sparkling harbor lights.These spectacular views are unique to North Peak; most homes are within the North Peak Mutual and Cuyamaca water districts.
Pine Hills
Total homes sold: 15
Median home size: 2BD/2BA, 1,786 sq. ft.
Median sale price: $834,067 or $399.75/sq. ft.
List vs. Sale price: 1% discount off list price in 2023 (same in 2022)
Median Days on Market: 50 days
In Summary: Pine Hills is one of Julian’s many great neighborhoods. It has its own private mutual water company, and most parcels are over one acre in size. It is a popular neighborhood, and it holds its value well.
Shelter Valley
Total Sold: 2
Average home size: 3BD/2BA, 1,617 sq ft.
Average sale price: $325,000 or $200/sq. ft.
List vs. Sale price: 1% discount off list price in 2023 (same in 2022)
Average Days on Market: 91 days
In Summary: Shelter Valley offers the best value for a single-family home and is surrounded by the stunning Anza-Borrego Desert State Park. Its high-desert elevation (2,320 feet) makes for a warmer winter and hotter summer than the nearly double-elevation Julian neighborhoods.
Whispering Pines
Total homes sold: 13
Median home size: 2BD/1BA, 926 sq. ft.
Median home price: $413,308 or $488.58/sq. ft
List price vs. Sale price: 1% discount off list price.
Median Days on Market: 38 days
In Summary: Whispering Pines resembles the Kentwood neighborhoods in average home size and sales price and shares the Majestic Pines Water District, a private mutual water company. Like the Kentwood 1 and II neighborhoods, it is close to Julian and offers more inventory than areas with larger parcels.
Wynola Area
Total sold: 1
Home size: 3BD/4BA, 2,182 sq. ft.
Home price: $750,000 or $343.72
List vs. Sale price: 1.1% discount off list price.
Days on Market: 56 days
In summary: The general Wynola area is what we call the area not in Wynola Estates. You will find significant variations in the size of homes and properties. It is a highly desirable area offering a slightly lower elevation, a more agricultural feel, and great privacy with a convenient proximity to downtown Julian.
Wynola Estates
Total sold: 4
Median home size: 2BD/3BA, 2,347 sq. ft.
Median sale price: $792,250 or $364.11/sq. ft.
List vs. Sale price: 1% discount off list price.
Median Days on Market: 40 days
In summary: Wynola Estates is lower in elevation than downtown Julian and has flatter lots than other Julian neighborhoods, and it is also a few minutes closer to the San Diego work centers. It too has its own private mutual water company.

